Abstract
- ScienceCentral is a free or open access full-text archive of scientific society journal literature hosted by the Korean Federation of Science and Technology Societies. It was launched in December 2013. We analyzed the number of articles deposited, page views by period, country of visitors, number of visitors, and entry point of visits. Descriptive statistics were presented. We also hypothesized that visitors accessed ScienceCentral mostly through Google and Google Scholar since ScienceCentral allows Googlebot to index it. The number of deposited articles was 19,419 from 124 journals in December 2016. The number of page views per month was 20,228 in December 2016. The top countries of visitors were South Korea (39.9%), the United States (13.26%), India (4.2%), China (3.4%), and Russia (3.2%). The average number of page views per article a month in December 2016 was 1.0. Google and Google Scholar were powerful referral sites to ScienceCentral. Except for direct visits to ScienceCentral, seven out of the top ten access sites to ScienceCentral were Google or Google Scholar sites from a variety of countries. Although the number of visitors and page views has increased continuously, the average number of page views per article a month has not increased.
-
Keywords: Access to information; Archives; Bibliographic databases; Open access publishing
Introduction
- For journals published by academic societies, scholarly journal literature platforms are important for exposure to researchers worldwide. What is the most important platform for scholarly journals at present? We suggest it is Google or Google Scholar, although medical researchers or physicians typically search PubMed or PubMed Central first [1]. Except for PubMed Central, archives of free or open access scholarly journals are rare. KoreaMed Synapse provides open access archives of medical journals published in Korea and comprised 131 journals with 90,404 articles as of January 17, 2017 [2]. It was launched in 2007 by the Korean Association of Medical Journal Editors. Open Access Korea Central comprises 86 scholarly journals in all fields published in Korea and has been maintained by the National Library of Korea. There is no public information on its launch year. In Japan, the Japan Science and Technology Information Aggregator, Electronic (J-STAGE) is the platform for 2,025 scholarly journals published in Japan [3]. It was developed by the Japan Science and Technology Agency to support the transmission of information. SciELO is a platform for 1,249 scholarly journals from 16 Latin American countries with 573,525 articles [4], which was launched in 1999. Among all these database platforms, only Open Access Korea Central provides the complete full-text Journal Article Tag Suite (JATS) extensible markup language (XML). KoreaMed Synapse contains only the abstract in XML if the main text is written in Korean. Even PubMed Central provides some articles as scanned-full text, not in JATS XML form.
- In 2013, the Korean Federation of Science and Technology Societies decided to host a full-text open or free access literature database platform for society journals based on full text JATS XML, entitled ScienceCentral [5]. The test version of ScienceCentral launched in September 2013. Although it is comparable to PubMed Central, it has some distinct features. First, it comprises all science fields, not only biomedical fields; second, journals in any language from anywhere in the world can be deposited, not only articles in English; third, it only provides full text JATS XML, not scanned full text; and fourth, it provides the translation into 80 languages via Google Translate. More than 3 years have passed since the launch of ScienceCentral. Therefore, it is time to evaluate the volume of article access from throughout the world. This paper presents an analysis of the visiting to ScienceCentral from 2014 to 2016 so that the usefulness of this unique database can be evaluated by government administrators who support this project and scientists who search the database. We also hypothesized that visitors approach ScienceCentral mostly through Google and Google Scholar since ScienceCentral has a script allowing access from the Googlebot.
Analysis of Deposit and Access Logs
- We analyzed the number of journals and articles deposited, page views by period, country of visitors, number of visitors, and access route to ScienceCentral from January 2014 to December 2016. Descriptive statistics are presented.
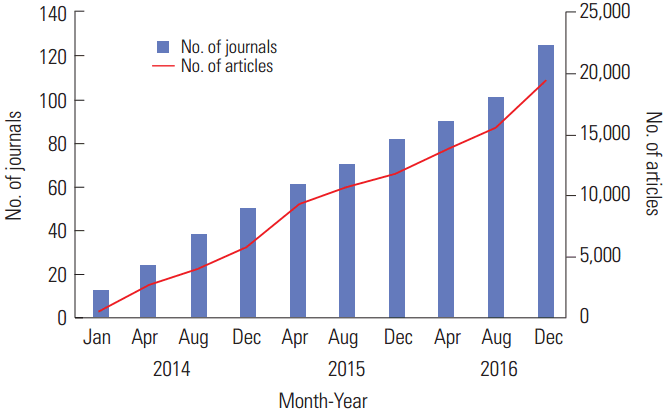
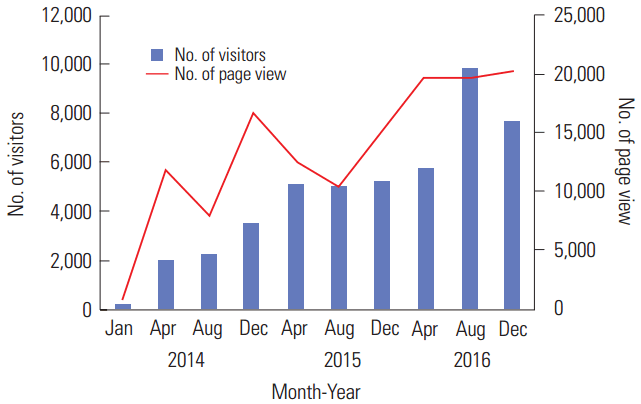
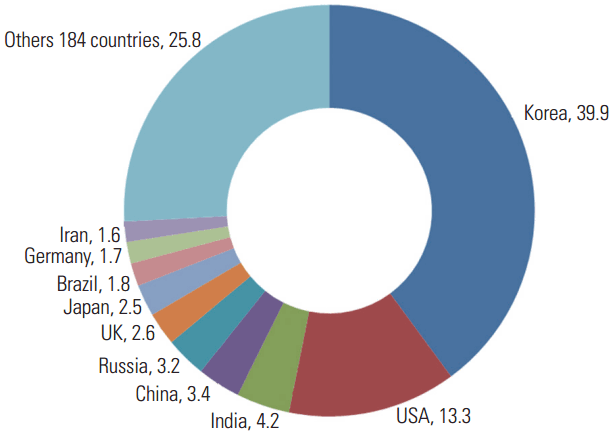
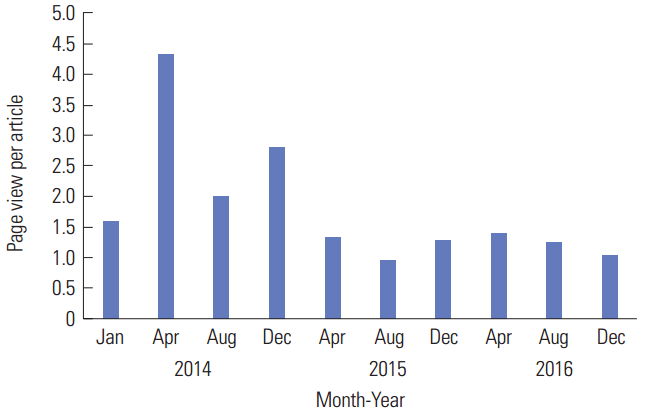
- In January 2014, 526 from 12 journals had been deposited. This had increased to 19,419 from 124 journals by December 2016 (Fig. 1). In January 2014, the number of visitors was 213, but the number had increased to 7,696 by December 2016. The number of page views per month was 845 in January 2014. It had increased to 20,228 by December 2016 (Fig. 2). Visits originated from 21 countries in January 2014 and 120 in December 2016. In the entire 3-year period from 2014 to 2016, visits originated from 203 countries. The ten countries with the most visitors were South Korea (39.9%), the United States (13.26%), India (4.2%), China (3.4%), Russia (3.2%), the United Kingdom (2.6%), Japan (2.5%), Brazil (1.8%), Germany (1.7%), and Iran (1.6%) (Fig. 3). The average number of page views per article per month has been fluctuating (Fig. 4). Out of the top 10 approaches to ScienceCentral, one is direct access and the other seven entry sites were Google and Google Scholar sites from a variety of countries (Table 1). Raw data of visits to ScienceCentral are available from Suppl. 1.
- The number of journals listed in ScienceCentral and number of articles included continuously increased from 2014 to 2016 (Fig. 1). The number of visitors and page views also continuously increased along with the number of journals and articles (Fig. 2). The number of countries of visits also increased to 120 in December 2016. The finding that the number of countries of origin of visits over the entire 3-year period was 203 reveals that ScienceCentral was visited from all over the world. That 39.9% of visitors were from Korea is not surprising because most of the journals listed in ScienceCentral are deposited by scholarly societies or non-profit organizations from Korea. Only three journals from outside of Korea submit their articles for indexing: Biochemia Medica from Croatia, Eurosurveillance from Sweden, and Pediatric Neurology Briefs from the United States. Given its origins in Korea, it is interesting to find that more than 60% of visitors are from outside of that country (Fig. 3). The second most common country of visit origin was the United States. This phenomenon likely arose from the fact that the United States is the top-ranking country in producing scholarly articles. The countries 39.9that follow in terms of number of scholarly articles published are India, China, and Russia. In fact, it was notable that so many visits originated from Russia. This phenomenon is difficult to explain. The number of monthly page views was constant in 2016 (Fig. 2). This is the reason why the average number of page views per article of ScienceCentral has decreased since 2014 (Fig. 4). Page views per article has been about 1.0 recently.
Conclusion
- It was found that the number of visitors to ScienceCentral has increased continuously along with the increase in the number of articles deposited; however, the number of page views leveled out in 2016. The average number of page views per article has decreased continuously since 2014. Another factor that should be taken into consideration with regard to the frequency of visits is the quality of Google Translate into 80 languages, which is rapidly developing. As the translation quality becomes excellent, the number of visitors will increase continuously and rapidly. Furthermore, the hypothesis that ScienceCentral has been visited mostly through Google or Google Scholar can be accepted.
Notes
-
Younsang Cho has been a program manager of ScienceCentral since 2013. No other potential conflict of interest relevant to this article was reported.
Supplementary Materials
Supplementary file is available from: https://doi.org/10.7910/DVN/UBTVUE
Suppl. 1. Analysis of deposited journals, articles, visitors, contries of visitors, and page views to ScienceCentral from January 2014 to December 2016
Fig. 1.Number of journals and articles deposited to ScienceCentral with passing time.

Fig. 2.Number of visitors to ScienceCentral and page views with passing time.

Fig. 3.Major countries of visits (%) to ScienceCentral from January 2014 to December 2016.

Fig. 4.Page views per article deposited to ScienceCentral from January 2014 to December 2016.

Table 1.Sites through which visitors accessed ScienceCentral from 2014 to 2016
|
Site of origin |
Classification |
No. of visitors |
% |
|
google.com |
Organic |
66,908 |
37.30 |
|
Direct |
None |
37,007 |
20.85 |
|
scholar.google.com |
Referral |
10,611 |
5.98 |
|
scholar.google.co.kr |
Referral |
8,591 |
4.84 |
|
scholar.google.co.in |
Referral |
1,947 |
1.10 |
|
scholar.google.co.uk |
Referral |
1,241 |
0.70 |
|
biochemia-medica.com |
Referral |
1,234 |
0.70 |
|
4webmasters.org |
Referral |
997 |
0.56 |
|
scholar.google.com.br |
Referral |
965 |
0.54 |
|
google.fr |
Referral |
915 |
0.52 |
|
2,491 Other sources |
Referral |
47,136 |
26.91 |
|
Total |
|
177,552 |
100 |
References
- 1. US National Library of Medicine. PubMed Central [Internet]. Bethesda: US National Library of Medicine; 2017 [cited 2017 Jan 17]. Available from: https://www.ncbi.nlm.nih.gov/pmc/.
- 2. Korean Association of Medical Journal Editors. KoreaMed Synapse [Internet]. Seoul: Korean Association of Medical Journal Editors; 2017 [cited 2017 Jan 17]. Available from: https://synapse.koreamed.org.
- 3. Japan Science and Technology Agency. Japan Science and Technology Information Aggregator, Electronic (J-STAGE) [Internet]. Kawaguchi: Japan Science and Technology Agency; 2017 [cited 2017 Jan 17]. Available from: https://www.jstage.jst.go.jp/browse.
- 4. Scientific Electronic Library Online. SciELO [Internet]. Sao Paulo: Scientific Electronic Library Online; 2017 [cited 2017 Jan 17]. Available from: http://www.scielo.org/.
- 5. Korean Federation of Science and Technology Societies. ScienceCentral [Internet]. Seoul: Korean Federation of Science and Technology Societies; 2017 [cited 2017 Jan 17]. Available from: https://www.e-ScienceCentral.org/.
Citations
Citations to this article as recorded by

- The rapid internationalization of Annals of Pediatric Endocrinology & Metabolism as evidenced by journal metrics
Sun Huh
Annals of Pediatric Endocrinology & Metabolism.2017; 22(2): 77. CrossRef - How to Deal with Ethical Issues Involving Animal Experiments and Identifiable Photographs in Articles Published in Archives of Plastic Surgery
Sun Huh
Archives of Plastic Surgery.2017; 44(06): 475. CrossRef
 , Sun Huh2


 KCSE
KCSE


 PubReader
 ePub Link
 Cite
Cite


