Market share of the largest publishers in Journal Citation Reports based on journal price and article processing charge
Article information

Abstract
Purpose
There are growing questions about the market share of the largest publishers. Although evaluations based on Journal Citation Reports (JCR) are important, librarians are more interested in journal costs. Therefore, this study was conducted with the aim of estimating the market share of the largest publishers listed in JCR using the journal subscription price (journal price) and article processing charge (APC).
Methods
The top 10 publishers were selected based on six indicators in JCR 2014 to 2018, and then their journal prices and APCs were investigated according to list prices. Other prior studies were also compared to estimate their market share more realistically because list and actual prices are not identical.
Results
The estimated average price of subscription journals in JCR was 2,300 US dollars and the average APC for an article was 2,652 US dollars. The APC per article was more expensive than the average journal price. Based on journal price and APC, the market influence of the top three publishers was 48.0%, but their market share was estimated to be 55.2% when annual reports and other studies were combined with this study. The difference was due to Elsevier’s journal costs, as Elsevier’s market share was higher than its market influence.
Conclusion
APCs require additional budgetary resources from institutions, but are another revenue source for publishers. Librarians need to reflect APC spending in journal subscription negotiations with the largest publishers. To clarify the market share more accurately, it is necessary to share information on subscription and APC costs paid by institutions.
Introduction
Background/rationale: As e-journal package contracts with publishers and inter-publisher mergers have induced markedly lopsided payments to the largest publishers, questions about their influence and dominance in the global journal market are growing. Many commercial publishers, such as Elsevier-Cell, Springer-Nature, and Wiley-Blackwell, focusing on science, technology, and medicine journals, are known to have a significant influence. However, the exact status of the market share and power of society publishers, the role of which varies across fields, remains unknown. In this situation, Outsell estimated that English-language science, technology, and medicine journal publishing had global revenues of 9.9 billion US dollars (USD) in 2017 [1]. Checking the market share of the largest publishers in the world journal market is essential for negotiations, but it is difficult to obtain accurate information because commercial publishers keep sensitive profit information confidential and treat their subscription agreements as trade secrets. The Korean Electronic Site License Initiative (KESLI) is negotiating journal subscriptions under these conditions. The biggest question in the KESLI negotiations is how to evaluate the e-journal prices proposed by the publishers and how to agree and proceed with a consortium contract in which rates would increase. We studied the influence of the largest journal publishers according to Journal Citation Reports (JCR) 2014 to 2018 by using six JCR indicators, including the journal impact factor, Eigenfactor score, and article influence score, along with the number of journals, citable items, and total cites [2]. Nonetheless, regarding the influence of the largest publishers, libraries and librarians are particularly sensitive to costs, although JCR indicatorbased measures of influence are also significant.
The largest publishers have been raising journal subscription prices (journal prices) faster than the rate of increase of library budgets or inflation. Article processing charges (APCs) are also expected to be a major revenue source for these publishers, as they expand open access (OA) journals. As journal prices and APCs are interrelated in journal publishing, librarians have begun to negotiate journal prices together with APC spending. Studies of journal subscription costs or library budgets have been limited by the reluctance of publishers and libraries to make this information public; therefore, large-scale studies on journal prices are rare [3].
Objectives: This study aimed to estimate the market share of the largest journal publishers listed in JCR using journal prices and APCs, as a follow-up study of the influence of those journal publishers based on six JCR indicators [2]. How large is the estimated market share of journal costs imposed by the publishers, as distinct from their influence measured by the six JCR indicators? To solve this research question, we roughly estimated the market share of the top three publishers based on journal price and APC. As this study could not deal with the paid costs [4,5], its results were also compared with those of previous studies to estimate the actual market share more precisely. The result of this study will provide practical assistance to libraries, librarians, and consortia negotiators.
Methods
Ethics statement: This was not a study with human subjects, so neither institutional review board approval nor informed consent was required.
Study design: This was a descriptive study conducted by collecting data on journal prices and APCs.
Data collection: To estimate market share of journal publishers, libraries’ subscription costs or publishers’ sales information is required, but it is difficult to collect accurate data. As the list journal prices and APCs may somewhat differ from the costs that are actually paid, the validity of the estimation can be increased by conducting an analysis in combination with other studies. This paper analyzed the top 10 publishers by collecting their journal prices and APCs.
To prepare a journal list, JCR data over the past 5 years, including the most recent edition of JCR 2018 in 2019, were exported to Excel, and a list of 12,201 unique journals was created by integrating them into a single list. Missing publisher names were added from Web of Science or Scopus, and the journal list was finally classified by the publisher imprints. Collecting all the JCR journal prices was difficult, to the point of impossibility. According to the authors’ paper based on six JCR indicators [2], the influence of the largest journal publishers was found to be 49.1% for the top three publishers, 58.0% for the top five, and 69.4% for the top 10. The top 10 publishers are, in order, Elsevier, Springer, Wiley, Taylor & Francis (T&F), Sage, Oxford University Press (OUP), American Chemical Society (ACS), Wolters Kluwer (Kluwer), Institute of Electrical and Electronics Engineers (IEEE), and Royal Society of Chemistry (RSC). This study limited the research target to the top 10 publishers, and we collected their prices from their Korean branches or publisher websites. We estimated the price level of the non-top 10 publishers as about 30.6% of all JCR journals [2], without trying to acquire more specific price information. To estimate the market share of the top three publishers more precisely, we compared the findings of this study with the publisher revenue and subscription amounts found in annual reports and other studies.
The prices were collected from February to April 2020 to reflect the latest information. For non-USD prices, we searched for foreign exchange rates in the United States Federal Reserve System and converted them into USD using the 1-year average for 2019. In this study, journal prices were analyzed using list prices instead of actual paid costs, online instead of print subscriptions, public rather than corporate affiliations, individual subscriptions rather than packages, and the USA region rather than the rest of the world. Although we tried to collect 2020 journal prices, the collected information for IEEE was from 2019. The 2020 journal prices for IEEE were calculated by applying the consortium increase rate in 2020. OUP did not provide APC information, so instead of each journal’s APC, the average APC from the INTACT project [6] from 2018 to 2019 was applied. For APCs, the CC-BYNC-ND price was applied, as it is cheaper than CC-BY. Fully OA journals without APC information or subscription-only journals without journal prices were excluded from the calculation of each average price.
Analysis methods: Data were tabulated, and the proportions of the cells were calculated.
Results
Journal prices and APCs of the top 10 publishers
The average price of subscription journals was higher than 3,000 USD for Elsevier, ACS, and RSC (Table 1). Most of the remaining publishers had average journal prices around 2,000 USD, but Sage, OUP, and IEEE were around 1,000 USD, which were the lowest among the top 10 publishers. For most of the publishers, except Elsevier and RSC, the APC per article was more expensive than the average journal price. The average APC for hybrid and fully OA journals was investigated, and the highest was found for ACS (3,871 USD), followed by Wiley (3,200 USD) and Springer (3,039 USD). The lowest average APC was found for RSC (2,017 USD), followed by IEEE (2,057 USD). Springer currently sets various APCs for each journal, but the APC was set at 3,000 USD per article when the “Open Choice” program launched in 2004. That APC price has since become more or less a de facto standard. Therefore, T&F, Sage, ACS, IEEE, and RSC also set the same APC for most journals and then applied discounts according to various options, such that the actual APC varies from article to article.

Results for the top 10 publishers by journal price and APC
As shown in Table 2, 23.6% of the journals had prices of 500 to 1,000 USD, followed by 17.0% with prices of 1,000 to 1,500 USD and 12.9% with prices of 5,000 USD or more. More than half of journals (50.9%) had APCs of 2,500 to 3,000 USD, while 16.5% had APCs of 3,000 to 3,500 USD and 13.2% had APCs of 2,000 to 2,500 USD. Most of the price points of APCs were around 3,000 USD, corresponding to the “Open Choice” level. Although it is doubtful whether the APCs set by some publishers have a scientific basis, the journal price was distributed more diversely than the APC, with the distribution of journals in various price intervals decreasing after a peak at 500 to 1,000 USD.
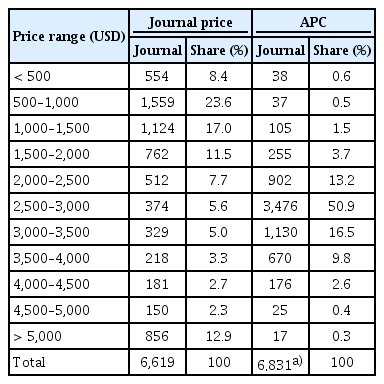
Distribution of price range by journal price and APC of the top 10 publishers
Market influence of the largest publishers versus others
Before any discounts, the average price of subscription journals in JCR was estimated to be 2,300 USD and the average APC was estimated to be 2,652 USD (Table 3). Thus, if one were to subscribe to all 10,535 journals—excluding fully OA journals from the 12,201 journals in the JCR—the sum of the journal prices was estimated to be about 24 million USD. Nonetheless, the total APC amount required to submit an article to each of the 11,287 fully and hybrid OA journals was about 30 million USD. The top three publishers accounted for a higher percentage in their journal share in JCR, and their average journal price was higher than that of the top 10 publishers. This means that the top three publishers are publishing numerous expensive and high-APC journals.
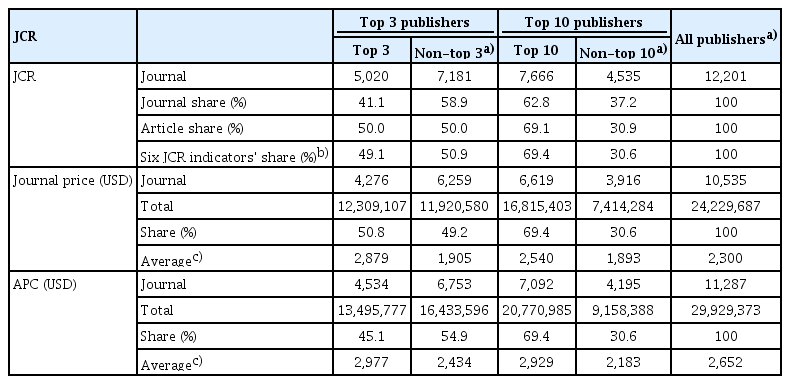
Market influence of the top three and top 10 publishers versus others
Expanding the scope of the inquiry from the top three publishers to the top 10, the APC share increased more than the journal price share. Most of the publishers added to the top 10 required higher APCs than journal prices. Since publishers are generating new revenue from APCs, it may be due to their price policies that the six publishers added to form the top 10 (excluding RSC) tried to compensate for their subscription sales, which are lower than those of the top three publishers, through APCs. The journal price level seemed to have some correlation with the number of articles and the six JCR indicators. The top three publishers showed a market influence of 49.1% according to the six JCR indicators [2], but their market share was estimated to be 50.8% based on journal prices and 45.1% based on APCs. Therefore, based on the investigated prices, the top three publishers were also found to have a high level of dominance in the journal market.
Discussion
Estimating the market share of the top three publishers: According to prior studies, in 2016, academic libraries in the USA paid 2.3 billion USD for journal subscriptions [7], and the 31 consortia in European countries spent 726 million European Union euros (EUR) [8]. Similar to these studies, some other studies have partially exposed the magnitude of subscription sales for various publisher imprints [3]. According to the publishers’ annual reports, Elsevier’s subscription sales are about 2.5 billion USD (2.0 billion British pound), Springer’s are 1.4 billion USD, and Wiley’s are 1.3 billion USD [9-11]. Only some publishers provide access to their annual reports, so there is a limit to the degree to which it is possible to investigate the world journal market share. Journal subscription costs at the national or regional level reported in papers and documents are only partially helpful in understanding the overall market share because the target libraries or publishers are limited.
Among the 10 publishers, the top three, including Nature Publishing Group (a Springer imprint), occupy about 70% of the total share [12], and the 10 publishers account for about 93 million British pound in 2014 subscriptions. However, because cost information is not included in these figures from the publisher, the paper was not used for the final estimation of market share. According to the National Research Council of Science and Technology, the total journal budget of 25 government-funded research institutes in South Korea (focused on the science and technology fields—excluding medicine—and not including university libraries) was about 12 million USD in 2020. In the materials budgets of 25 research libraries in 2018 to 2020, the share of journal subscriptions was 71.0% [13]. The top three publishers accounted for 67.1% of those expenditures, and the top 10 for 78.8%. Those results present an even higher share of the largest publishers than was found herein.
The journal market share of the top three publishers was comprehensively predicted by averaging six sources, including annual reports and the other studies cited above, along with this study (Table 4) [1-3,8-11,13]. The final result was about 55.2%, with a range from 48.0% to 67.1%. This level is much higher than the directly calculated result of this study (48.0%) and the share of 49.1% calculated based on the six JCR indicators [2]. The reason for this is the major difference between Elsevier’s list and actual prices. However, Springer and Wiley showed a small difference. As a result, the estimated market share shift to Elsevier was much stronger than in the authors’ studies.
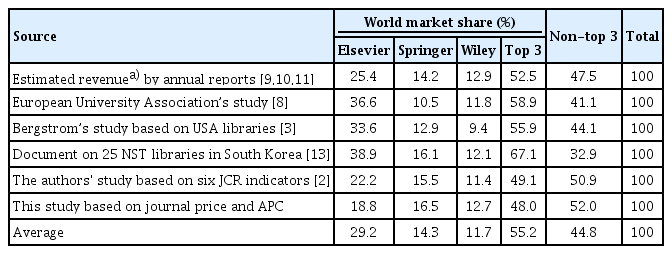
Estimation of the average share of the top three publishers in world journal market
Evaluation of journal prices and APCs: To determine whether the investigated prices of the top 10 publishers were related to the six JCR indicators, the findings of this study were graphically compared to those of the authors’ previous study [2]. Springer, Wiley, and Kluwer seemed highly correlated, but the remaining publishers had poor correlation (Fig. 1). In particular, Elsevier had a much lower APC relative to the six JCR indicators and journal price, but the converse was found for T&F and Sage. The shares of ACS, IEEE, and RSC according to both journal prices and APCs were lower than their shares according to the six JCR indicators.
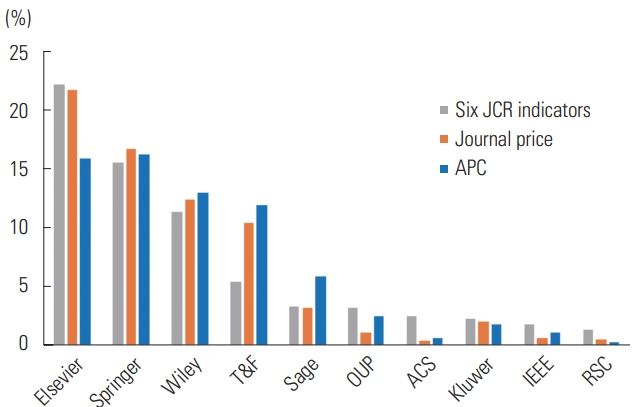
Comparison of the results of this study with those obtained using the six Journal Citation Reports (JCR) indicators for the top 10 publishers. APC, article processing charge; T&F, Taylor & Francis; OUP, Oxford University Press; ACS, American Chemical Society; Kluwer, Wolters Kluwer; IEEE, Institute of Electrical and Electronics Engineers; RSC, Royal Society of Chemistry.
According to EBSCO’s 5-year price increase history, the average increase rate of journal prices for invoices in USD from 2010 to 2019 was 5.7% annually, and the average journal price paid by academic and medical universities in 2019 was 1,785 USD [14]. However, the average price of the JCR journals estimated in this study was 2,300 USD. The reason for this discrepancy is that the present study analyzed list prices before any discount, while the EBSCO data is the final contract amounts, reflecting journal preferences and discount for packages or consortia. Using the average journal price of 2,300 USD, publishers need to obtain subscriptions for roughly 409 libraries for each of the 10,535 subscription journals in order to account for the 9.9 billion USD of the world journal market [1].
In this study, the average APC was estimated to be 2,652 USD, which was higher than the average journal price. Since the average annual number of articles per JCR journal is 127 [2], the 10,535 subscription journals will annually publish about 1,337,945 articles. Multiplying this number of articles by the 2,652 USD of APC for OA publishing, 3.5 billion USD would be spent annually. Other papers reported that the average APC was 2,415 USD and 2,727 USD in 2014 [4,15]. According to the 2014-2018 APC data in the INTACT project [6] published by the Open Knowledge Foundation Germany, the average APC was 2,255 USD (2,015 EUR), corresponding to total spending of 202 million EUR for 100,401 OA articles. The APCs paid in the INTACT project were lower than those in this study, and this discrepancy likely reflects discounts. Therefore, an APC of 2,000 EUR per article, which was based on the OA2020 plan, was established as the appropriate level [16].
The average expenditures of institutions are 87.5% for subscriptions, 11.8% for APCs, and 0.6% for administrative costs [4]. The OA publishing market was estimated to be around 758 million USD in 2019, and therefore, the APC market share was estimated to account for 7.7% of the world journal market. Although this study did not accurately show the costs of subscription contracts or APCs, it could be used as a reference when negotiating contracts for journal subscriptions.
Limitation: Journals that changed publishers were considered not to have any fluctuations; instead, the current publisher was used, because it would be time-consuming and challenging to analyze the history of publisher changes by year. In investigating journal prices and APCs, this study applied list prices, even though these may be different from the finally contracted and paid prices. The journal prices and APCs of the non-top 10 publishers and the world journal market were estimated, not directly calculated.
Conclusion: In this study, the average APC for an article was estimated to be more expensive than the average journal price of one JCR journal. According to journal prices and APCs, the market influence of the top three publishers was 48.0%. However, in combination with information on actual subscriptions obtained from the annual reports and other studies, their market share was finally estimated to be 55.2%. The difference was caused by Elsevier’s real market share, which was higher than its market influence. As a result, the shift to the top three publishers from the top 10 was stronger in terms of actual contract amounts. In addition to subscription revenue, publishers are expected to increase APC revenue by expanding OA articles and journals. Therefore, librarians need to watch the market share trend of the largest journal publishers based on journal prices and APCs, and should actively reflect APC spending in journal subscription negotiations. In conclusion, a more accurate market share of the most significant journal publishers can be identified through the disclosure and sharing of subscription and APC costs paid by institutions.
Notes
Conflict of Interest
No potential conflict of interest relevant to this article was reported.
Data availability
Dataset file is available from: the Harvard Dataverse at: https://doi.org/10.7910/DVN/FZ3OIA
Dataset 1. List prices of the top 10 journal publishers in JCR 2014 to 2018