Articles
- Page Path
- HOME > Sci Ed > Volume 8(1); 2021 > Article
-
Original Article
A bibliometric and co-occurrence analysis of COVID-19–related literature published between December 2019 and June 2020 -
Md. Sayeed Al-Zaman

-
Science Editing 2021;8(1):57-63.
DOI: https://doi.org/10.6087/kcse.230
Published online: February 20, 2021
Department of Journalism and Media Studies, Jahangirnagar University, Savar, Dhaka, Bangladesh
- Correspondence to Md. Sayeed Al-Zaman msalzaman@juniv.edu
• Received: September 1, 2020 • Accepted: November 8, 2020
Copyright © 2021 Korean Council of Science Editors
This is an open access article distributed under the terms of the Creative Commons Attribution License (http://creativecommons.org/licenses/by/4.0/), which permits unrestricted use, distribution, and reproduction in any medium, provided the original work is properly cited.
Abstract
-
Purpose
- The main purposes of this study were to analyze the document types and languages of published papers on coronavirus disease 2019 (COVID-19), along with the top authors, publications, countries, institutions, and disciplines, and to analyze the co-occurrence of keywords and bibliographic coupling of countries and sources of the most-cited COVID-19 literature.
-
Methods
- This study analyzed 16,384 COVID-19 studies published between December 2019 and June 2020. The data were extracted from the Web of Science database using four keywords: “COVID-19,” “coronavirus,” “2019-nCoV,” and “SARS-CoV-2.” The top 500 mostcited documents were analyzed for bibliographic and citation network visualization.
-
Results
- The studies were published in 19 different languages, and English (95.313%) was the most common. Of 157 research-producing countries, the United States (25.433%) was in the leading position. Wang Y (n=94) was the top author, and the BMJ (n=488) was the top source. The University of London (n=488) was the leading organization, and medicine-related papers (n=2,259) accounted for the highest proportion. The co-occurrence of keywords analysis identified “coronavirus,” “COVID-19,” “SARS-CoV-2,” “2019-nCoV,” and “pneumonia” as the most frequent words. The bibliographic coupling analysis of countries and sources showed the strongest collaborative links between China and the United States and between the New England Journal of Medicine and the JAMA.
-
Conclusion
- Collaboration between the United States and China was key in COVID-19 research during this period. Although BMJ was the leading title for COVID-19 articles, the co-author link between New England Journal of Medicine and JAMA was the strongest.
- Background/rationale: The first coronavirus disease 2019 (COVID-19) case was identified on November 17, 2019, in Wuhan, the capital of Hubei Province in China [1]. The virus reached at least 25 countries as of February 6, 2020, and became global soon after [2].
- This pandemic led researchers from various disciplines to produce a huge number of papers: some are medicine-related, while some are healthcare- and virology-related. Understanding ongoing COVID-19–related research trends has become essential, and a bibliometric analysis of the relevant published literature may be able to provide some insights in this respect. Meanwhile, several COVID-19–related bibliometric papers have added some relevant findings to the international scholarship. Some researchers took only recent publications into account [3-5], while others analyzed publications from a longer time span [6,7]. A few common measurements of these studies were top journals, authors, publication types, countries, institutions, and languages, publication citations, and bibliographic coupling analyses. These studies found English to be the top language [4,8]; human studies [8] and epidemiology [4] to be the top focuses; the BMJ [8,9], the Journal of Virology [7], Viruses [1], The Lancet [9], and the Journal of Medical Virology [4] to be the top journals; original articles [1] and review articles [8] to be the top publication types; Memish ZA [1] and Yuen KY [7] to be the top authors; the University of Hong Kong [1,7,9] to be the top institution; and China [1,9] and the United States [7] to be the top countries.
- Some other relevant bibliometric studies [3,5,6,10-14] analyzed similar indices, having one or more of the following limitations: they only mentioned the most productive country and the most common language, type, and source, but did not extend the results and explanation, such as the number of countries, types, and languages of the publications; they often did not mention the data collection period, which makes it difficult to understand the context; most of their data and extent were small and limited, failing to produce a broader and representative picture of COVID-19 research trends; and they were likely to produce contradictory results, although different research aims of the papers also could be responsible for such different results.
- Objective: The present study aimed to present a comprehensive picture of COVID-19 research by analyzing all relevant published papers during the chosen time span. This study attempted to present both linear and graphical representations of the bibliometric data: document types and languages of the published papers, along with the top authors, publications, countries, institutions, and disciplines. Furthermore, it aimed to identify the co-occurrence of keywords and bibliographic coupling of countries and the sources of the most-cited documents.
Introduction
- Ethics statement: Neither approval by the institutional review board nor informed consent was required because this was a literature-based study.
- Study design: This was a bibliometric study of a specific topic from a literature database.
- Data sources/measurement: Bibliometric data were extracted from the Web of Science database. The data processing was conducted in three phases. First, the relevant literature was searched with four selected keywords, adding the Boolean operator “OR”: “COVID-19” OR “Coronavirus” OR “2019-nCoV” OR “SARS-CoV-2.” The search included the title, abstract, and author’s keywords. The keywords were determined based on previous studies. For example, some studies used “coronavirus” and “COVID-19” to search the literature [1], while others used “SARS-CoV-2” and “COVID-19” [8]. A study used the 23 most common keywords to search the Scopus database for available COVID-19–related literature [9]. From December 2019 to June 2020, 16,384 scholarly publications appeared in different sources. In December 2019, 793 papers were published, which was 4.84% of the total share. However, the publication number surged in 2020. From January to June 2020, 15,591 papers were published, accounting for 95.16% of the total share. Second, the data were downloaded from the database in the .txt file format. The downloaded file was transformed, restructured, and imported into a statistical program for the final analysis. Graphical illustrations of the co-occurrence of keywords and bibliographic coupling analysis were produced with VOSviewer 1.6.15 (https://www.vosviewer.com/), based on the data of 500 mostcited publications from the total publications to provide some insights regarding trends in COVID-19 research. It should be noted that Web of Science gives access to citation data for up to 500 documents. Third, the data processing had three tiers: general analysis, top percentile analysis, and bibliographic and citation network analysis. The two indices in the general analysis were the types and languages of the published papers. The five indices in the top percentile analysis were the top 10 authors, sources, countries, organizations, and disciplines of the published papers. In the percentile indices, a total of 55,352 authors, 2,964 sources, 159 countries, 12,805 organizations, and 221 disciplines were found in the 16,384 published papers. The co-occurrence analysis focused on both authors’ and all keywords, while the bibliographic coupling analysis focused on countries’ and sources’ coupling.
- Statistical methods: Descriptive statistics were applied. IBM SPSS Statistics ver. 25 (IBM Corp., Armonk, NY, USA) was used for the analysis
Methods
- Document types: Fifteen types of documents were found (Table 1). Of them, articles had the highest share (n = 6,556, 40.015%), followed by editorial material (n= 4,138, 25.256%). It is important to mention that many papers from certain categories often overlap, which may increase the sum of the papers. For example, an article or a review can also be an early access paper.
- Languages: Papers were found in 19 different languages (Table 2). Of them, English was disproportionately common (n = 15,616, 95.313%), followed by German (n= 203, 1.239%) and Spanish (n=196, 1.196%). Catalan, Croatian, Icelandic, and Indonesian were on the bottom of the list, with only 1 (0.006%) paper each.
- Top authors: The top 10 authors accounted for 0.02% of the total authors who produced 5.663% (n= 928) of the total output (Table 3). A remarkable number of authors were anonymous (n = 282, 1.721%). Otherwise, Wang Y (n = 94) produced the highest number of papers, followed by Zhang Y (n= 88) and Li Y (n= 77).
- Top sources: The top 10 sources of publications constituted 0.34% of the total sources. They published 1,974 papers, or 12.049% of the total (Table 4). Of them, the BMJ (n = 488) published the highest number of papers, followed by the Journal of Medical Virology (n= 303) and the Journal of Infection (n= 261).
- Top countries: The top 10 countries constituted 6.29% of the total countries. Unlike the top 10 authors and sources, the top 10 countries produced the majority of publications, accounting for 89.312% (n= 14,633) of the total output (Table 5). The United States secured the leading position with 4,167 published papers, followed by China (n = 2,979) and Italy (n = 1,921). It should be mentioned that many publications may share two or more countries at the same time.
- Top institutions: The top 10 organizations comprised 0.08% of the total organizations. They cumulatively produced 2,895 papers, which is 17.67% of the total output (Table 6). Of them, the University of London (n = 488) had the highest output, while Harvard University (n= 403) and the University of California system (n= 352) were in the second and third position in the list, respectively.
- Top focuses: The top 10 disciplines accounted for 4.53% of the total disciplines. They produce 8,814 papers and 53.797% of the total output (Table 7). Medicine-related papers (n= 2,259) were most common, followed by public environment-related (n= 1,203) and infectious disease-related papers (n= 1,146).
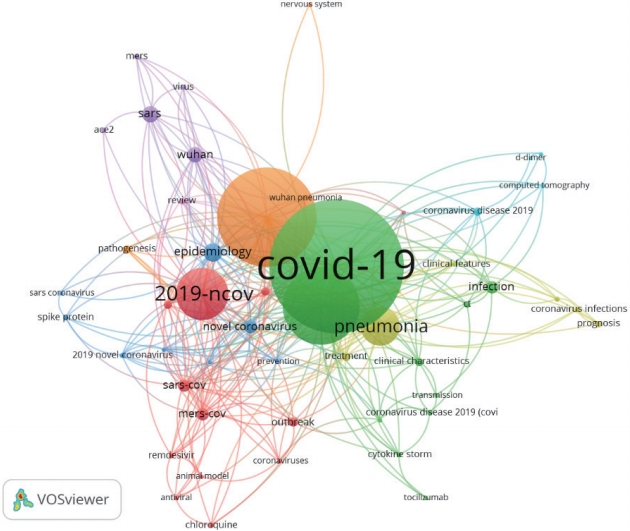
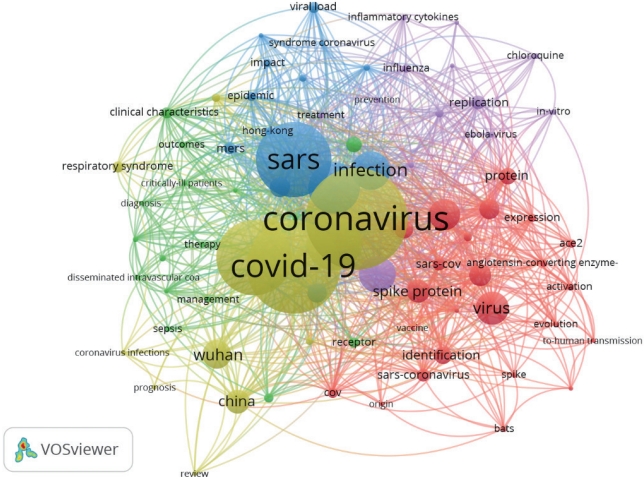
- Co-occurrence of keywords for 500 most-cited articles: In the analysis of co-occurrence of all keywords, 83 out of 1,003 keywords met the threshold of at least five occurrences, producing five clusters, 1,254 links, and a total link strength of 3,061 (Fig. 1). The top repetitions were: coronavirus (n= 105), COVID-19 (n= 96), SARS (n= 77), pneumonia (n= 77), SARS-CoV-2 (n= 57), acute respiratory syndrome (n= 53), infection (n = 40), and 2019-nCoV (n = 38). In the analysis of the cooccurrence of authors’ keywords, 51 out of 503 keywords met the threshold with a minimum of three occurrences, producing nine clusters, 304 links, and a total link strength of 724 (Fig. 2). The top repetitions were: COVID-19 (n= 95), coronavirus (n= 70), SARS-CoV-2 (n= 54), 2019-nCoV (n= 37), and pneumonia (n= 28).
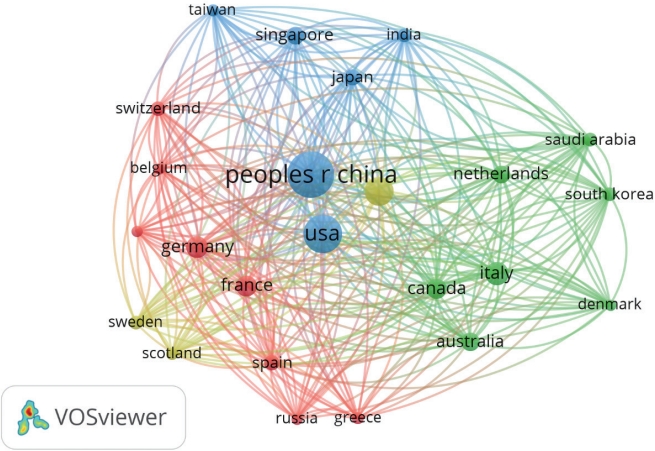
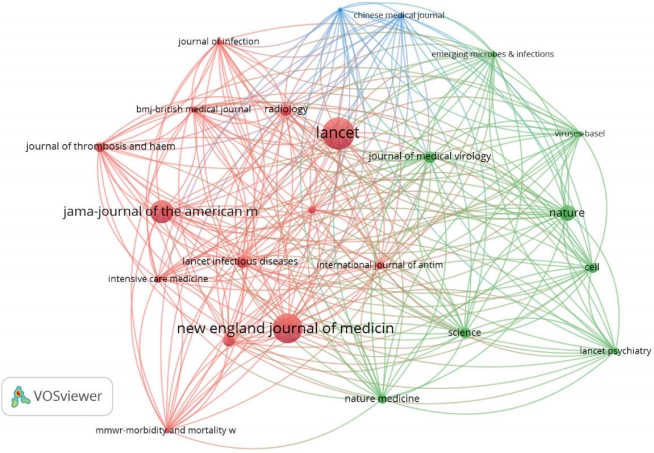
- Bibliographic coupling for the 500 most-cited articles: In the analysis of bibliographic coupling of countries, 24 out of 62 countries met the threshold with a minimum of five documents, producing four clusters (Fig. 3). The top countries were China (n= 275), the United States (n= 160), the United Kingdom (n= 68), and Italy (n= 37). The strongest collaborative link was found between China and the United States (35,811). In the analysis of bibliographic coupling of sources, 23 of 179 sources met the threshold with a minimum of five documents, producing three clusters (Fig. 4). The top sources were New England Journal of Medicine (n = 42), JAMA (n = 30), and The Lancet (n= 30). The strongest link was between New England Journal of Medicine and JAMA (267), followed by JAMA and The Lancet (249) and New England Journal of Medicine and The Lancet (238).
Results
- Key results: This bibliometric study analyzed 16,384 Web of Science-indexed COVID-19 studies published between December 2019 and June 2020. The analysis presented some novel findings. First, the data contained 15 types of publications, of which articles were most common, followed by editorial materials. This finding indicates a surge in original COVID-19 research publications, most of which may be related to medicine and public health. Some previous studies also found similar results, but with articles followed by either reviews and notes [1] or reviews and short commentaries [4], whereas some studies found that only reviews were the most popular type of publications [8]. Second, of the 19 different languages, English has the largest share, followed by German and Spanish. Two other studies produced almost the same results [4,8], except with Chinese in the second position after English [4]. Third, the 10 leading countries produced ninetenths of the total publications. The United States was found to be the leading country with the highest publications, followed by China, which is similar to a previous result [7]. However, two previous studies [1,9] produced contradictory results, showing China to be the leading country. Fourth, the 10 leading authors accounted for a small proportion of papers. Wang Y was found to be the leading researcher, whereas other studies found Memish ZA and Yuen KY to be the leading authors [1,7]. The list of the top researchers indicated that although the US produced the highest number of papers, Chinese researchers were in the leading position in terms of the number of publications. Fifth, the present study found that the BMJ was the source of the most COVID-19 studies, followed by the Journal of Medical Virology; this both supports [8] and contradicts [1,4] previous results. It should be kept in mind that the highest paper production does not guarantee the highest number of citations: therefore, this study also incorporated an analysis of the most-cited documents for better understanding the sources.
- Sixth, the University of London produced the highest number of papers, followed by Harvard University. In contrast, three studies [1,7,9] found that the University of Hong Kong was the top-producing institute. The leading institutions also hint towards the existence of three contemporary research hotspots in the United Kingdom, the United States, and China. Seventh, medicine-related publications were the most common in terms of discipline, followed by environmental health- and infectious disease-related papers. This finding suggests that researchers are placing a strong emphasis on the medical aspects of COVID-19, whereas a previous result showed epidemiology in the leading position [4]. Eighth, the co-occurrence network analysis of the 500 most cited papers showed that the five most common repetitive keywords: “coronavirus,” “COVID-19,” “SARS-CoV-2,” 2019-nCoV,” and “pneumonia.” This result is similar to previous findings [9]. Ninth, the bibliographic coupling analysis of countries and sources showed the strongest collaborative links between China and the United States, and between New England Journal of Medicine and JAMA.
- Limitation: The co-occurrence network analyses were done with only 500 most-cited articles. If the entire dataset had been included, the results may have been different.
- Conclusion: This study offers a broader picture of COVID-19 research output for academics and researchers, presenting some novel results that both support and contradict previous studies. Moreover, the addition of the co-occurrence and bibliographic coupling analyses of the most-cited literature also helped to shed light on some trends in COVID-19 research.
Discussion
-
Conflict of Interest
No potential conflict of interest relevant to this article was reported.
-
Funding
The author received no financial support for this article.
-
Data Availability
Data are available from the author upon reasonable request.
Notes
Fig. 1.Co-occurrence of all keywords. Red (cluster 1), green (cluster 2), blue (cluster 3), yellow (cluster 4), and violet (cluster 5) represent five clusters.


Fig. 2.Co-occurrence of authors’ keywords. Red (cluster 1), green (cluster 2), deep blue (cluster 3), yellow (cluster 4), violet (cluster 5), light blue (cluster 6), orange (cluster 7), brown (cluster 8), and pink (cluster 9) represent nine clusters.


Fig. 3.Bibliographic coupling of countries. Red (cluster 1), green (cluster 2), blue (cluster 3), and yellow (cluster 4) represent four clusters.


Fig. 4.Bibliographic coupling of sources. Red (cluster 1), green (cluster 2), and blue (cluster 3) represent three clusters.


Table 1.Types of publications
Table 2.Languages of publications
Table 3.Top 10 authors
Table 4.Top 10 sources
Table 5.Top 10 countries
Table 6.Top 10 organizations
Table 7.Top 10 disciplines
- 1. Darsono D, Rohmana JA, Busro B. Against COVID-19 pandemic: bibliometric assessment of world scholars’ international publications related to COVID-19. J Komun Ikat Sarj Komun Indones 2020;5:75-89.https://doi.org/10.25008/jkiski.v5i356. Article
- 2. Wu YC, Chen CS, Chan YJ. The outbreak of COVID-19: an overview. J Chin Med Assoc 2020;83:217-20.https://doi.org/10.1097/JCMA.0000000000000270. ArticlePubMedPMC
- 3. Zhai F, Zhai Y, Cong C, et al. Research progress of coronavirus based on bibliometric analysis. Int J Environ Res Public Health 2020;17:3766. https://doi.org/10.3390/ijerph17113766. ArticlePubMedPMC
- 4. Lou J, Tian SJ, Niu SM, et al. Coronavirus disease 2019: a bibliometric analysis and review. Eur Rev Med Pharmacol Sci 2020;24:3411-21.https://doi.org/10.26355/eurrev_202003_20712. ArticlePubMed
- 5. Golinelli D, Nuzzolese AG, Boetto E, et al. The impact of early scientific literature in response to COVID-19: a scientometric perspective. medRxiv [Preprint]. 2020;Apr. 18. [cited 2020 Dec 8]. https://doi.org/10.1101/2020.04.120066183. Article
- 6. Zhou Y, Chen L. Twenty-year span of global coronavirus research trends: a bibliometric analysis. Int J Environ Res Public Health 2020;17:3082. https://doi.org/10.3390/ijerph17093082. ArticlePubMedPMC
- 7. Tao Z, Zhou S, Yao R, et al. COVID-19 will stimulate a new coronavirus research breakthrough: a 20-year bibliometric analysis. Ann Transl Med 2020;8:528. https://doi.org/10.21037/atm.2020.04.26. ArticlePubMedPMC
- 8. Kambhampati SB, Vaishya R, Vaish A. Unprecedented surge in publications related to COVID-19 in the first three months of pandemic: a bibliometric analytic report. J Clin Orthop Trauma 2020;11(Suppl 3):S304-6.https://doi.org/10.1016/j.jcot.2020.04.030. ArticlePubMedPMC
- 9. Dehghanbanadaki H, Seif F, Vahidi Y, et al. Bibliometric analysis of global scientific research on coronavirus (COVID-19). Med J Islam Repub Iran 2020;34:51. https://doi.org/10.34171/mjiri.34.51. ArticlePubMedPMC
- 10. Chen Y, Guo YB, Guo R, et al. Visual analysis of coronavirus disease 2019 (COVID-19) studies based on bibliometrics. Zhongguo Zhong Yao Za Zhi 2020;45:2239-48.https://doi.org/19540/j.cnki.cjcmm.20200320.501. ArticlePubMed
- 11. Hossain MM. Current status of global research on novel coronavirus disease (COVID-19): a bibliometric analysis and knowledge mapping. F1000Research [Preprint]. 2020;May. 8. [cited 2020 Dec 8]. https://doi.org/10.12688/f1000research.23690.1. Article
- 12. DE Felice F, Polimeni A. Coronavirus disease (COVID-19): a machine learning bibliometric analysis. In Vivo 2020;34(3 Suppl):1613-7.https://doi.org/10.21873/invivo.11951. ArticlePubMedPMC
- 13. Hamidah I, Sriyono S, Hudha MN. A bibliometric analysis of COVID-19 research using vosviewer. Indones J Sci Technol 2020;5:209-16.https://doi.org/10.17509/ijost.v5i2.24522. Article
- 14. Chahrour M, Assi S, Bejjani M, et al. A bibliometric analysis of COVID-19 research activity: a call for increased output. Cureus 2020;12:e7357. https://doi.org/10.7759/cureus.7357. ArticlePubMedPMC
References
Figure & Data
References
Citations
Citations to this article as recorded by 

- Sustainable business model innovation literature: a bibliometrics analysis
Ling Pan, Zeshui Xu, Marinko Skare
Review of Managerial Science.2023; 17(3): 757. CrossRef - A Bibliometric and Co-Occurrence Analysis of Work-Life Balance
Soumi Majumder, Debasish Biswas
International Journal of Information Systems and Supply Chain Management.2023; 16(1): 1. CrossRef - A koronavírus-járvány a közgazdasági szakirodalomban. Egy új határterület tudománymetriai elemzése
Ádám Török, Andrea Magda Nagy, Boglárka Konka
Közgazdasági Szemle.2023; 70(3): 284. CrossRef - Bibliometric and Subject Analysis of 100 Most-Cited Articles in the Field of Art Therapy
Hoda Homavandi, Masoud Motalebi Kashani, Zahra Batooli
Journal of Creativity in Mental Health.2023; : 1. CrossRef - Fault diagnosis of photovoltaic systems using artificial intelligence: A bibliometric approach
Edgar Hernando Sepúlveda-Oviedo, Louise Travé-Massuyès, Audine Subias, Marko Pavlov, Corinne Alonso
Heliyon.2023; 9(11): e21491. CrossRef - Current trends in sustainable organization management: A bibliometric analysis
Hellen Ogutu, Youssef El Archi, Lóránt Dénes Dávid
Oeconomia Copernicana.2023; 14(1): 11. CrossRef - Gamification in education: A scientometric, content and co-occurrence analysis of systematic review and meta-analysis articles
Somayyeh Nadi-Ravandi, Zahra Batooli
Education and Information Technologies.2022; 27(7): 10207. CrossRef - Between panic and motivation: did the first wave of COVID-19 affect scientific publishing in Mediterranean countries?
Mona Farouk Ali
Scientometrics.2022; 127(6): 3083. CrossRef - Eye-Related COVID-19: A Bibliometric Analysis of the Scientific Production Indexed in Scopus
Verónica García-Pascual, Elvira García-Beltrán, Begoña Domenech-Amigot
International Journal of Environmental Research and Public Health.2022; 19(16): 9927. CrossRef - Bibliometric Analysis of the Scientific Research on Sustainability in the Impact of Social Media on Higher Education during the COVID-19 Pandemic
Saddam Hossain, M. Sadik Batcha, Ibrahim Atoum, Naved Ahmad, Afnan Al-Shehri
Sustainability.2022; 14(24): 16388. CrossRef - Modeling the Epidemic Growth of Preprints on COVID-19 and SARS-CoV-2
Giovani L. Vasconcelos, Luan P. Cordeiro, Gerson C. Duarte-Filho, Arthur A. Brum
Frontiers in Physics.2021;[Epub] CrossRef - COVID-19 Konulu Medya ve İletişim Çalışmalarının Bibliyometrik Profili
Hikmet TOSYALI
Selçuk İletişim.2021; 14(4): 1578. CrossRef

 KCSE
KCSE
 PubReader
 ePub Link
 Cite
Cite


